

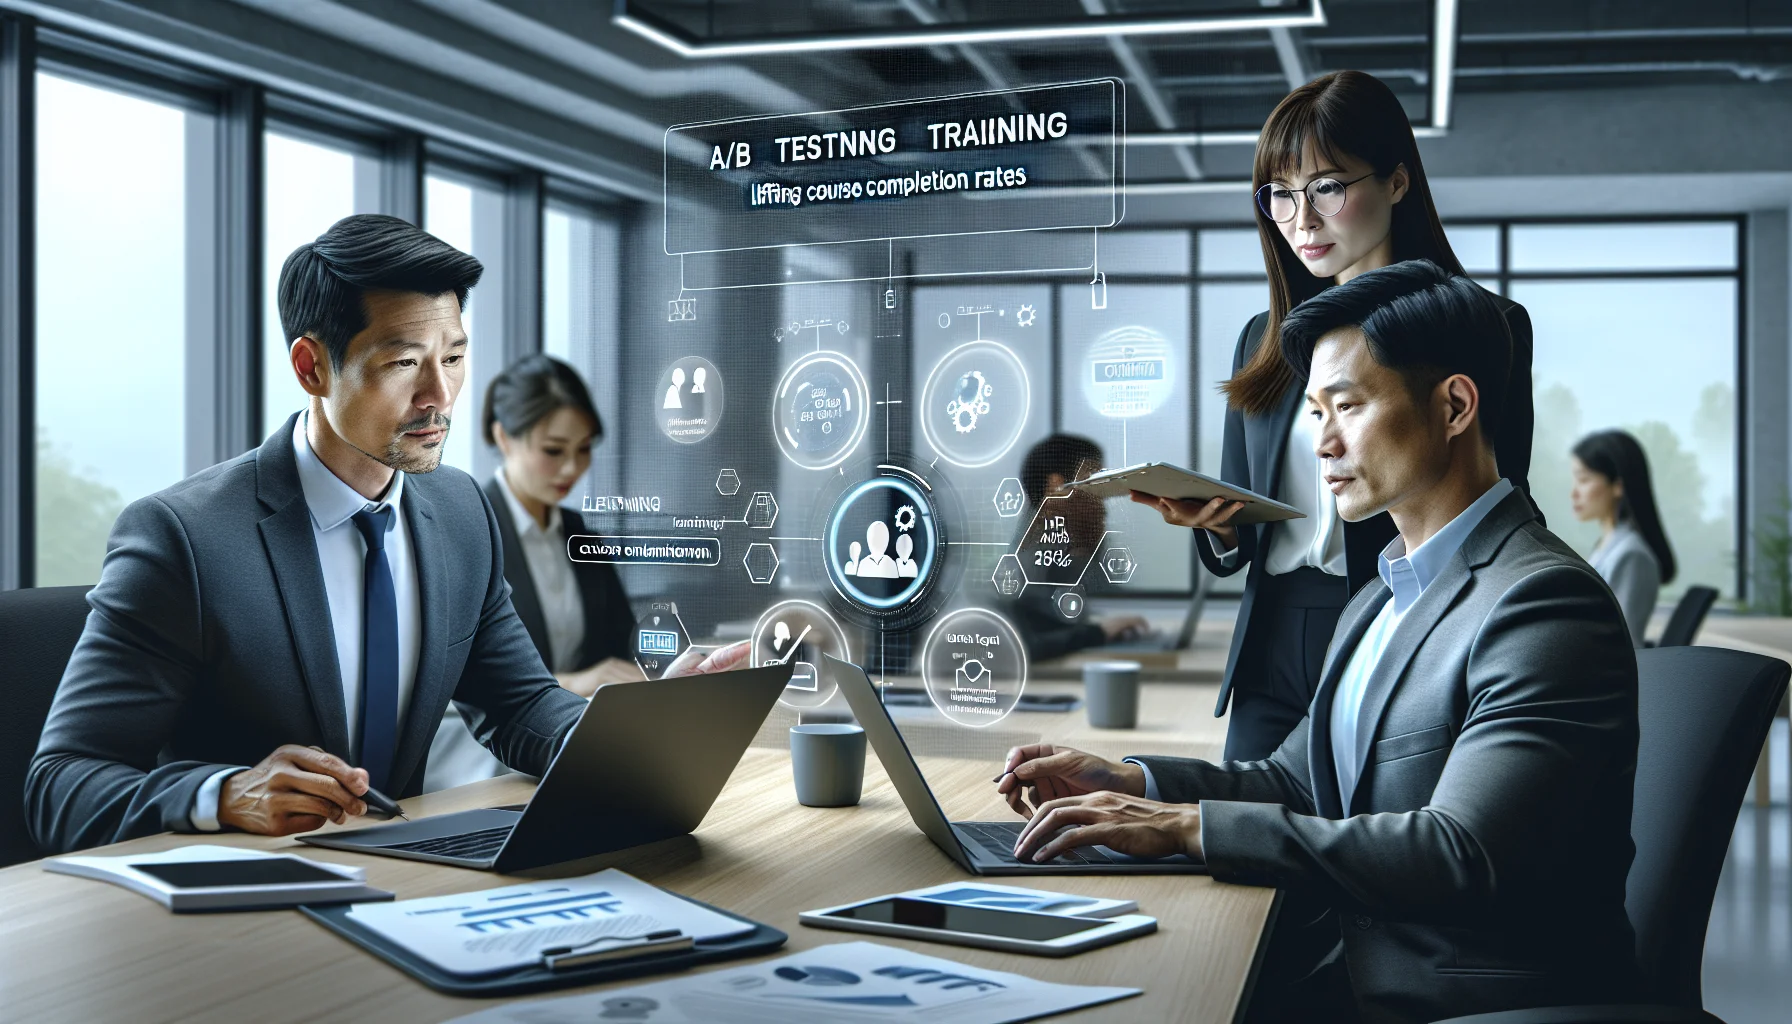
This article presents a practical five-step A/B testing training framework for LMS: hypothesis, metric selection, sample sizing, randomization, and analysis. It prioritizes high-impact tests (email cadence, microlearning), shares sample benchmark lifts (~7–10%), and offers solutions for small samples and implementation complexity to scale learning optimization.
A/B testing training is the most direct, evidence-based method to raise course completion rates and outpace static industry averages. In our experience, applying controlled learning A/B tests to learning management systems identifies barriers to completion faster than qualitative feedback alone. This article explains a practical, step-by-step approach to running experiments, shares specific test ideas and sample results, and tackles common obstacles like small sample sizes and implementation complexity.
Use this as a playbook for turning your LMS into a reliable data engine for the board: design clear hypotheses, select the right metrics, run statistically valid experiments, and translate results into scalable changes. Below you'll find an actionable implementation guide, test examples, and what lifts you can reasonably expect compared to industry norms.
Industry averages for voluntary training completion often sit below 60% for many organizations, depending on the topic and audience. A/B testing training lets teams move past assumptions about engagement by measuring real learner behavior. Rather than guessing whether a shorter module or a different reminder cadence will help, an experiment directly compares outcomes.
Key benefits include faster identification of friction points, incremental improvement without major redesigns, and prioritized investment in what actually moves the metric your board cares about: completion.
To run effective A/B testing training experiments you need a repeatable framework. Below is a practical five-step process we use when advising people analytics teams.
Step-by-step framework:
A strong hypothesis pairs a specific change with an expected numeric outcome. For example: "If we send a second microlearning reminder two days after the initial invite, then 30-day completion will increase by 6 percentage points." That sentence contains the treatment, the timing, the metric, and the expected lift — which makes planning and sizing straightforward.
Sample sizing starts with three numbers: baseline completion rate, desired MDE, and statistical power (commonly 80%). Use an online calculator or a simple formula to determine group sizes. For example, with a 50% baseline and an MDE of 6 percentage points, you typically need several hundred learners per arm to detect the effect with confidence. If you can't reach those numbers, consider alternative designs (see the pitfalls section).
Running a broad set of learning A/B tests is useful, but prioritize tests that are cheap to implement and high-impact if positive. Below are prioritized test ideas and the rationale for each.
High-priority experiments (fast to implement, likely-to-move-metric):
Secondary tests (requires content change or longer development):
Prioritize by expected lift and cost to implement: quick messaging changes often yield 5–15% lifts with little development work, whereas full course redesigns could yield higher lifts but at a much larger cost.
Below are two realistic A/B testing training examples with sample outcomes drawn from aggregated client experiences and industry benchmarks. These are illustrative, not guaranteed; results depend on context and audience.
Example 1 — Email cadence test:
Example 2 — Microlearning sequence:
We’ve found organizations reduce admin time by over 60% using integrated systems that automate experiment delivery and reporting, including platforms like Upscend, freeing up trainers to focus on content and scaling winners across audiences.
Two of the most frequent barriers to reliable A/B testing training are insufficient sample size and implementation complexity in the LMS. Address both with pragmatic workarounds.
Small sample solutions:
Implementation complexity strategies:
Yes. Small talent teams should focus on high-impact, low-friction tests like communication timing and microlearning segmentation. Use sequential testing methods and conservative decision rules to avoid false positives. When sample size is an absolute constraint, combine A/B testing with qualitative feedback to validate signals before expensive rollouts.
To move from isolated wins to sustained improvement, embed A/B testing training as a continuous capability. That requires governance, tooling, and clear decision rules.
Practical scaling checklist:
To operationalize at scale, create templates for hypotheses, sample-size calculators, and standardized result reports that include both statistical inference and ROI-style interpretation (time saved, projected completions gained). Establish a monthly cadence to review failed and successful tests and extract learnings into content playbooks.
Completion rate is necessary but not sufficient. Track engagement depth (time on module), assessment pass rate, behavior change proxies (follow-up task completion), and retention of knowledge at 30/90 days. Combining these gives a fuller picture of whether a change improves learning, not just completion.
Running structured A/B testing training programs shifts L&D from opinion-driven decisions to measurable improvements. Start with high-impact, low-cost experiments (email cadence, microlearning), ensure proper sample sizing and randomization, and measure wins in both relative and absolute terms. Over time, incremental lifts compound — a 7–10% relative lift applied across multiple courses drives notable increases in organizational capability and measurable ROI.
Next step: choose one quick test you can implement this week — for example, a second reminder at day 3 vs no reminder — calculate the required sample size using your baseline, preregister the hypothesis, and run the experiment for a defined period. Use the framework above to analyze and scale the winner.
Call to action: If you want a simple template to run your first experiment (hypothesis worksheet, sample-size calculator, and analysis checklist), request it from your L&D analytics team and commit to running at least three prioritized tests this quarter to begin shifting completion above industry averages.
The Upscend Team provides actionable insights on technology and business strategy.
Book a walkthrough and we'll show you how it applies to your own content.
 L&D
L&DDecember 21, 2025
This article shows how LMS analytics convert learner data into actionable insights to improve completion, mastery, and time-to-competency. It outlines core metrics, real-time dashboards, personalization techniques, and a five-step rollout including A/B testing. Readers learn practical KPIs, reporting tools, and governance needed to operationalize analytics-driven learning.
 General
December 22, 2025
This article explains how LMS course design improves completion, retention, and on-the-job performance by using backward design, microlearning, scenario-based assessments, and analytics. It provides a six-step implementation roadmap, practical tools, and common pitfalls to avoid so teams can pilot and scale measurable online training programs.
 General
December 22, 2025
Actionable steps for running LMS A/B testing: define clear hypotheses, randomize assignment, and track primary metrics like completion and retention. The article explains sample-size rules, analysis checks, implementation options (native LMS or API/LTI), and offers practical test ideas and a checklist to avoid common pitfalls.
 Lms
LmsDecember 23, 2025
This article explains how to design and automate lms learning nudges to improve course completion. It outlines triggers, rule engines, message templates, and a channel mix (in‑LMS, email, push). Start with a small pilot, A/B test timing and messaging, then scale playbooks that show measurable lift.