

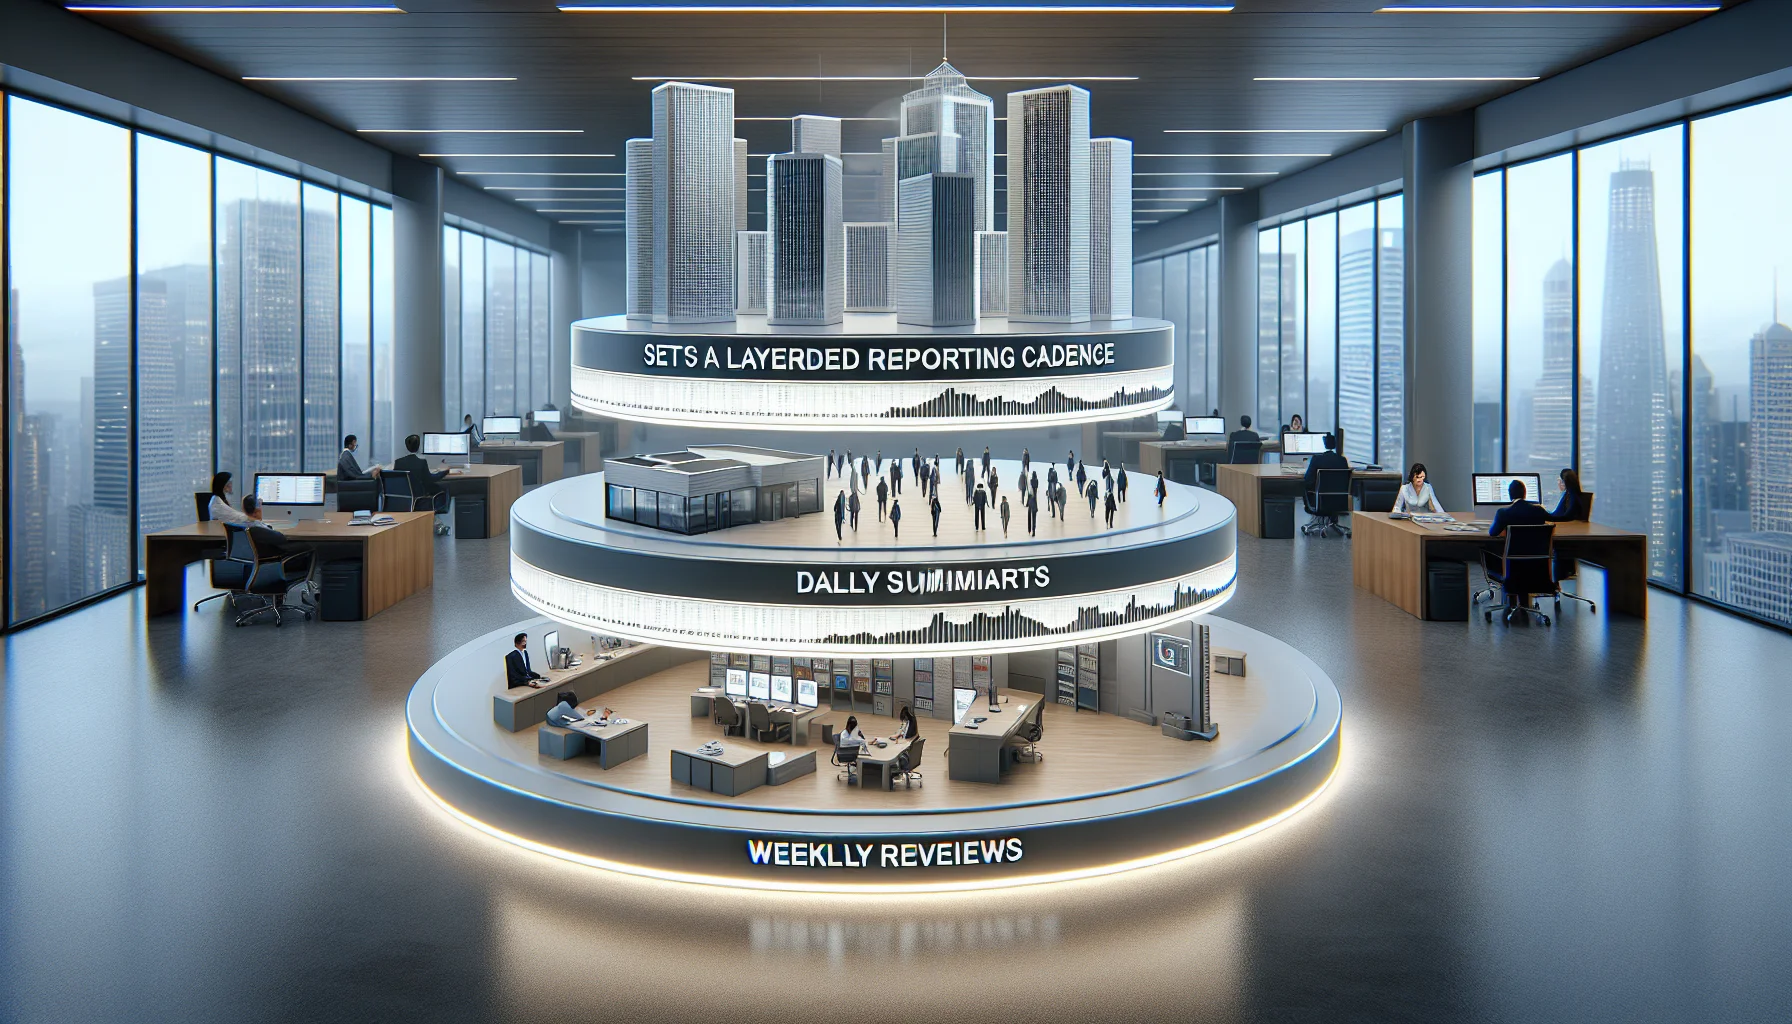
This article recommends a layered reporting cadence—real-time alerts, daily rollups, weekly dashboards and monthly analytics—to measure skills progress effectively. It explains how to diagnose decision tempo, design role-based dashboards, and implement a pilot (map owners, define KPIs, automate data). Start small and measure action rate, time-to-remediation and manager satisfaction.
Determining the right reporting cadence is one of the most practical levers learning leaders can pull when measuring skills progress. In our experience, a cadence that aligns data velocity, stakeholder decision cycles and learning rhythms is far more valuable than a one-size-fits-all schedule. This article breaks down a pragmatic framework for choosing an optimal reporting cadence for skills gap analytics, with examples from manufacturing and service sectors and step-by-step implementation guidance.
Before prescribing a reporting cadence, start by mapping the decision points that depend on skills data. Ask: who acts on this information, how fast do they need it, and what actions follow?
We’ve found the most robust frameworks begin with three diagnostic questions:
Answering these informs whether to adopt a real-time reporting model, a daily summary, or a periodic deep-dive. A misaligned cadence creates noise: too-frequent reports fatigue managers; too-infrequent reports delay corrective action.
Common frequency buckets are real-time, daily, weekly, and monthly. Each has distinct value depending on the maturity of your analytics and the nature of skills being measured.
Trade-offs to weigh:
There is no single correct answer, but an evidence-driven approach works best. We recommend a hybrid model:
This layered model preserves the immediacy of real-time reporting where it matters, while protecting strategic reviews from transient noise. Implementing multiple cadences also lets you map different KPIs to the cadence that best reflects their purpose.
Manufacturing environments often require tighter loops because skills deficits can affect safety, quality and throughput immediately. When deciding on reporting cadence for manufacturing, blend sensor-driven data and human assessments.
Recommended approach for manufacturing:
In practice, teams we’ve worked with settle on a two-tier cadence: immediate alarms for compliance and daily summaries for operations, with weekly management reviews. This combination balances urgency with learning momentum.
Dashboard cadence translates your chosen reporting cadence into UI patterns, alert thresholds and data pipelines. The design must support three roles: frontline operators, line managers and L&D strategists.
Key design principles:
It’s platforms that combine ease-of-use with smart automation — like Upscend — that tend to outperform legacy systems in terms of user adoption and ROI. Such solutions make it straightforward to operationalize a layered cadence: push critical alerts, publish daily digests, and schedule monthly executive reports without duplicating effort.
Practical dashboard cadence patterns:
Moving from theory to practice requires disciplined steps. Below is a pragmatic checklist we use with clients to implement an effective reporting cadence.
Common pitfalls:
Track meta-KPIs about your reporting: report open rates, action completion rates, time from alert to remediation, and manager satisfaction. If actions lag, frequency may need adjustment or the reports need clearer next steps.
Two brief examples illustrate how cadence choices change outcomes.
Example 1 — Automotive assembly line: A plant implemented immediate certification alerts and daily shift summaries. Within three months, skills progress accelerated because supervisors received timely, actionable coaching prompts tied to specific stations. Monthly analytics then informed role redesign and training spend.
Example 2 — Field service: A utility provider used weekly dashboards for technicians and monthly executive reviews. They layered in real-time anomaly alerts for safety-critical competencies. The hybrid cadence reduced repeat call-backs and improved first-time fix rates.
Industry trends to watch:
Choosing an optimal reporting cadence for skills-gap measurement is a strategic decision that affects adoption, speed of remediation and ROI. The best practice is a layered cadence: use real-time reporting for critical failures, daily summaries for operational control, weekly dashboards for coaching, and monthly reviews for strategic decisions.
Start small: map decision owners, pilot a hybrid cadence in one unit, and measure both skills progress and the effectiveness of the reporting itself. Iterate based on actions taken after each report rather than on raw delivery metrics alone.
Next step: Run a four-week pilot using the checklist in this article and measure three meta-KPIs: action rate, time-to-remediation, and manager satisfaction. Use those results to scale cadence across teams.
The Upscend Team provides actionable insights on technology and business strategy.
Book a walkthrough and we'll show you how it applies to your own content.
 General
December 14, 2025
Provides a practical playbook to design and run a performance improvement plan as a coaching framework. Includes a one-page PIP template, step-by-step implementation workflow with a 45–60 day cadence, recommended metrics, and outcome paths (success, extension, termination). Focuses on diagnosis, objective language, manager coaching, and HR calibration.
 ESG & Sustainability Training
January 6, 2026
This article compares daily, weekly, monthly and quarterly reporting cadences to help managers manage up with data. Use a three-question decision guide—define the decision, map the risk horizon, and design the signal—then pick a layered rhythm (alerts, weekly, monthly/quarterly). Includes templates and dashboard automation tips.
 HR & People Analytics Insights
January 6, 2026
Use event triggers and a hybrid skills refresh cadence to keep taxonomies current without disrupting work. Run micro-reviews quarterly, semiannual formal refreshes, and event-driven releases for urgent changes; version releases semantically (patch/minor/major). Pilot, align stakeholders, and track adoption, skills-gap closure, and hiring improvements.