


This article gives a tactical playbook for running rapid time-to-competency experiments: five low-risk pilots, two compact A/B designs, resource estimates, and a one-page pilot brief. It explains measurable success metrics, timelines, and common pitfalls so L&D teams can produce executive-ready evidence in 4–8 weeks.
Running focused time-to-competency experiments is the fastest way for L&D teams to demonstrate measurable business impact. In our experience, teams that treat pilots as mini-experiments — with clear hypotheses, compact timelines, and simple metrics — can produce board-ready evidence in weeks, not months. This article is a tactical playbook for busy learning teams: low-risk pilot ideas, A/B test designs, resource estimates, and a one-page pilot brief that helps you move from concept to executive-ready results.
Below you'll find step-by-step pilot designs that fit constrained budgets, practical success metrics, and a repeatable framework for proving value quickly.
Choose pilots that target a single competency and a narrow population (new hires, recent promotions, or a single role). Each pilot below is framed with a concise hypothesis, success metrics, a sample timeline, and required data — the exact ingredients you need to run rapid, repeatable time-to-competency experiments.
We recommend running 2–3 pilots in parallel (different cohorts) to reduce risk and see pattern-level results fast.
Hypothesis: Short, role-aligned microlearning plus two coaching check-ins will reduce ramp time by 20% versus standard onboarding.
Hypothesis: A focused 3-day bootcamp plus an assessment-gated pathway will deliver competency for critical tasks 30% faster than self-study.
Hypothesis: Structured manager checkpoints at weeks 1, 2 and 4 reduce back-and-forth time and accelerate independent performance by 25%.
Tools that remove administrative friction make these experiments faster to run and analyze. The turning point for most teams isn’t just creating more content — it’s removing friction. Tools like Upscend help by making analytics and personalization part of the core process.
Hypothesis: Requiring a short skills assessment to unlock next modules reduces remediation time and lowers rework by 40%.
Hypothesis: Short, scheduled peer practice sessions plus a micro-practice checklist cut supervised practice hours by 35%.
Design A/B tests to isolate one variable at a time. Keep sample sizes small but statistically useful — aim for cohorts of 30–50 learners per variant for operational pilots. Below are two compact designs you can run inside an LMS over 4–6 weeks.
Always register a hypothesis and primary metric before launch.
Design A — Microlearning vs. Standard Onboarding
Design B — Bootcamp vs. Self-study
For most time-to-competency experiments, 4–8 weeks captures onboarding cycles and early performance signals. Shorter windows (2–4 weeks) work for micro-skills where task frequency is high.
Limited resources are the main barrier. In our experience, you can run a credible pilot with a small cross-functional team and minimal content. Below are pragmatic resource estimates you can adapt.
Use this checklist to confirm feasibility before launching each pilot.
Executives want clear, comparable outcomes. Frame pilot results as a sequence: hypothesis → evidence → impact → ask. Use visuals and one-page summaries with before/after KPIs and a clear scaling recommendation.
Key presentation elements include effect size, confidence (qualitative and quantitative), cost-to-scale, and business impact (e.g., revenue per day saved).
Be ready to answer: "How reliable is this finding?", "What does scaling cost?", and "What is the break-even time to ROI?" Pre-calculate a conservative ROI using 3 scaling scenarios: conservative, likely, aggressive.
Use this template to get stakeholder buy-in in one page. It's designed to be completed in 30 minutes and shared with HR, managers, and finance.
When time-to-competency is the KPI, measurement noise and scope creep are the usual pitfalls. We've seen three recurring issues and the fixes that make pilots credible.
Pitfall 1: No baseline. Fix: capture a 2–4 week baseline before changes and use matched cohorts.
Pitfall 2: Multiple variables changed at once. Fix: change only one variable per pilot or run a factorial design if you have capacity.
Pitfall 3: Data gaps (missing timestamps, inconsistent assessments). Fix: instrument the LMS with mandatory checkpoints and use short, objective assessments.
Two practical tips: focus on metrics tied to business outcomes (task output, revenue, quality) and keep pilots visible to managers so adoption barriers are identified early.
Short, well-instrumented time-to-competency experiments give L&D the evidence needed to move from anecdotes to decisions. Start with a narrow scope, use the one-page brief, and run 2–3 concurrent pilots to compare patterns. In our experience, teams that commit to disciplined hypotheses and simple primary metrics can produce executive-ready results within 6–8 weeks.
Next step: pick one pilot from this playbook, fill the one-page pilot brief, and schedule a 30-minute kickoff with managers and data owners. That single meeting often unlocks the data and approvals you need to prove value fast.
Call to action: Use the one-page pilot brief above to scope your first pilot this quarter and set a go/no-go review at week 6.
The Upscend Team provides actionable insights on technology and business strategy.
Book a walkthrough and we'll show you how it applies to your own content.
 L&D
L&DDecember 14, 2025
This playbook shows how to run rapid training A/B testing: form testable hypotheses, pick behavior-linked metrics, estimate sample sizes, and run randomized variants. It includes implementation checklists, analysis rules, and case examples so L&D teams can iterate every 2–6 weeks and turn hypotheses into measurable performance gains.
 Lms
LmsDecember 25, 2025
Across tech, retail, healthcare, and service, time-to-competency case studies show microlearning, coaching, and simulations commonly halve ramp time. The article provides baseline metrics, measured outcomes, and a six-step playbook—define targets, baseline, micro-practice, simulation, coaching, and iterate—so teams can run a four-week pilot and measure 30/60/90-day results.
 Workplace Culture&Soft Skills
January 5, 2026
Treat pilots as disciplined experiments: define a clear hypothesis, limit scope, and protect participants with psychological safety. Run weekly learning sprints, neutral facilitation, and mixed qualitative–quantitative measurement. Use one-page charters and risk assessments; scale only after causal evidence, operational readiness, and validated risk plans.
 HR & People Analytics Insights
January 6, 2026
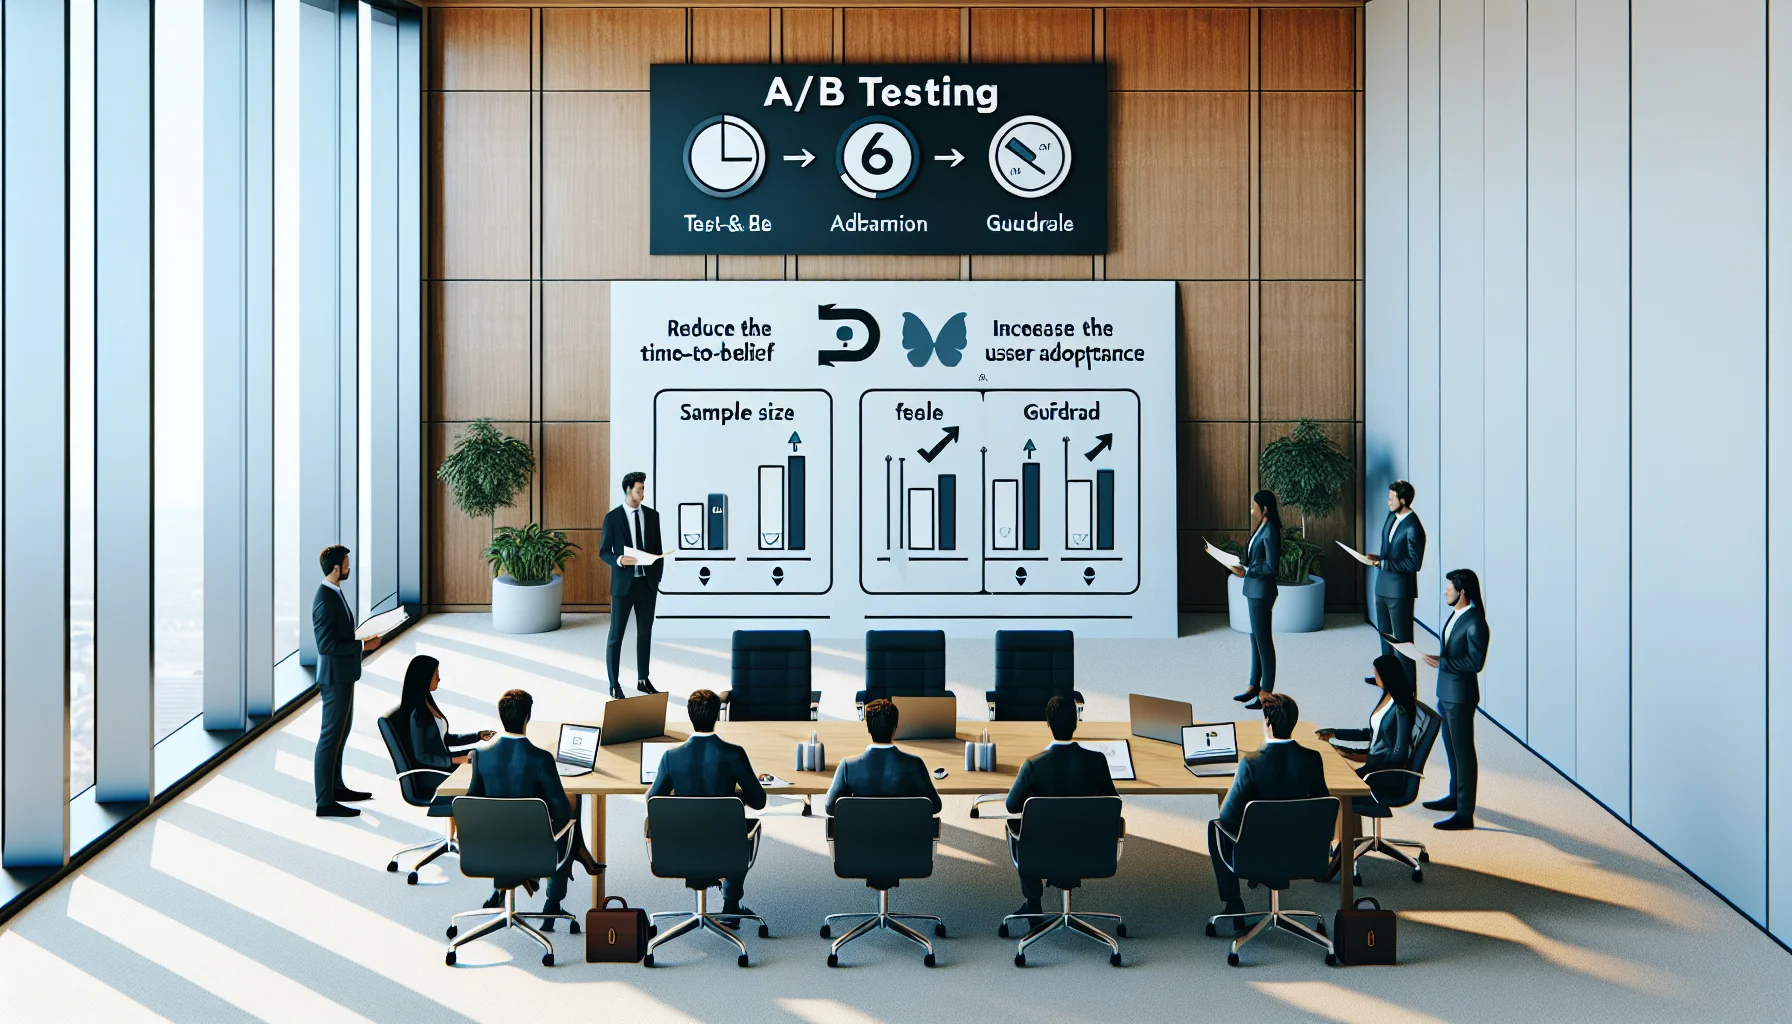
This article shows how A/B testing LMS experiments shorten learners' time-to-belief by exposing friction and measuring applied behavior. It outlines experiment design (hypothesis, metrics, sample size), tooling choices, six ready templates, an interpreted example result, and ethical guardrails—so teams can run practical tests and scale winners quickly.